12 lead ECG examples

Please enable JavaScript in your browser to see this interactive content.

Pulse point

12-lead ECG – posterior-lead placement:

  • V1 – V3 are moved round to become V7 – V9
  • They are placed on the same horizontal plane as V4
  • V7 Posterior axillary line
  • V8 Midscapular line in between V7 & V9
  • V9 To the left of the spine

12 Lead ECG Interpretation

When interpreting a 12-lead ECG it is important to use a systematic approach. This involves looking at the rhythm strip on the 12-lead ECG to determine heart rate and rhythm, using the previously recommended 6-step approach. The complex configuration and intervals of the complexes, for example, PR, QRS and QT should be examined and measured to identify any delays or abnormalities in conduction (for example, AV, Bundle Branch block or pre-excitation).

The ECG should be examined to look for evidence of the following:

  • R wave progression; normal or abnormal cardiac axis; chamber enlargement; or hypertrophy (seen by complexes bigger than expected)
  • ST segment and T waves changes (resulting from acute ischemia; myocardial infarction; inflammation; or drug and electrolyte abnormalities)
  • Presence of pathological (abnormal) Q waves i.e. > 0.04 duration, > 1/4 of the following R wave

Please enable JavaScript in your browser to see this interactive content.

12 lead ECG

Why use 12 lead?

A 12-lead ECG is an important tool in clinical decision making and can provide a wealth of information, for example, diagnosis of evolving MI; identify potentially life threatening arrhythmias; long term effects of sustained hypertension; or acute effects of a pulmonary embolus. In contrast to cardiac monitoring, the 12-lead ECG shows the 3-dimensional electrical activity of the heart recorded from 12 different leads or viewpoints. It provides the whole picture. This is achieved by using Bipolar (I, II & III) and Unipolar leads (augmented leads & precordial chest leads).

ECG electrodes are placed on specific areas of the body in predetermined positions so that different pictures of the heart’s electrical activity can be recorded accurately and replicated between recordings.

The bipolar limb leads show the electrical differences between the positive and negative electrodes placed on the limbs as far away from the heart as possible. These 3 leads are equidistant from the heart and create an equilateral triangle (Einthovens triangle) which the heart sits in the centre of.

  • Lead 1 shows the electrical difference between the left arm (positive electrode) and the right arm (negative electrode)
  • Lead 2 shows the electrical difference between right arm (negative electrode) and left foot (positive electrode)
  • Lead 3 shows the electrical difference between the left arm (negative electrode) and left foot (positive electrode)

Please enable JavaScript in your browser to see this interactive content.

The Normal 12 lead ECG

When looking at an ECG its important to know what is normal.

Within the first 6 leads (I,II,III, avR, avL and avF) all, with the exception of aVR, should be upright.

In the precordial or chest leads the r wave progresses from small to tall from V1 to V6

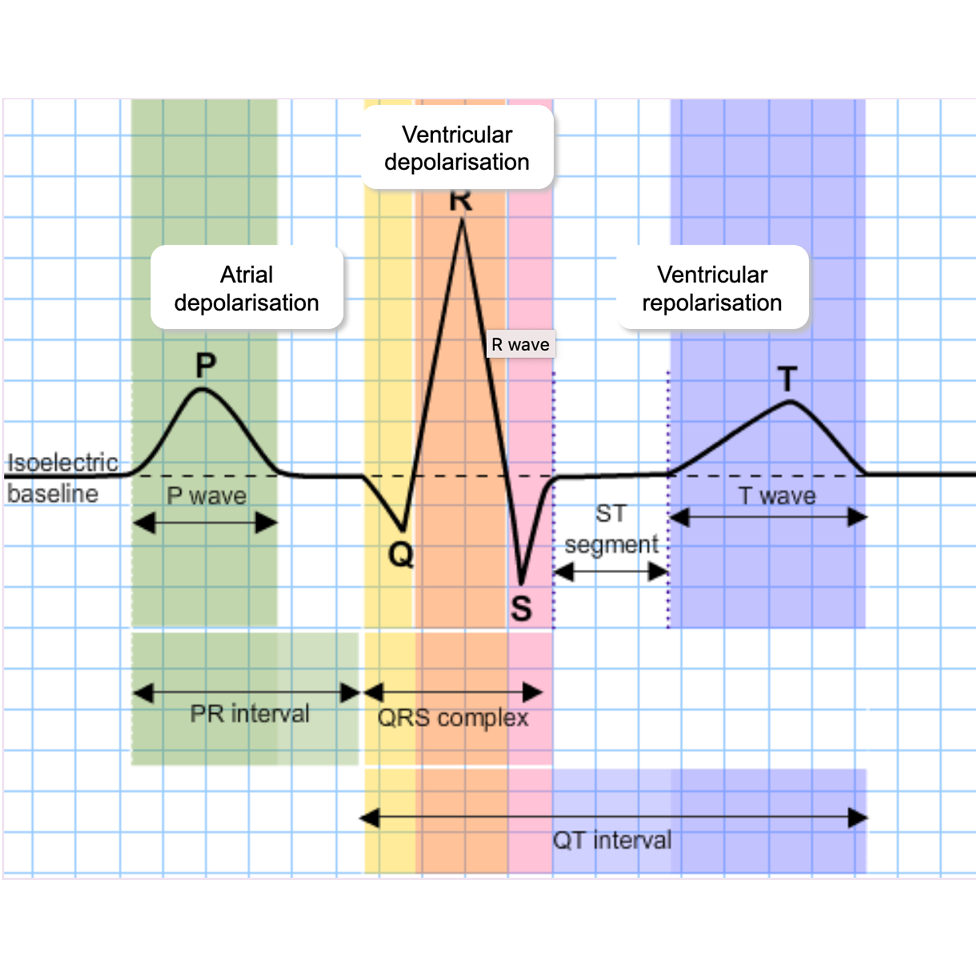
The polarity or direction of the ST segment and T wave are generally the same as the preceding QRS complex, for example, if the QRS complex is positive or upright then the T wave will also be positive.

All ST segments should remain on the isoelectric line or baseline.

Please enable JavaScript in your browser to see this interactive content.

See Common Cardiac Investigations: The Electrocardiogram (ECG) for a video from Glasgow University on indications, equipment, placement, preparation and procedure and recording an ECG.

Applying the 6 step approach

The following section will allow you to apply this approach to analysing common arrhythmias.

This will include:

  • sinus rhythms
  • atrial arrhythmias
  • ventricular arrhythmias
  • conduction abnormalities

If you want to remind yourself of the 6-step approach you may want to revise the following rhythms.

Please enable JavaScript in your browser to see this interactive content.

Having now completed the rhythm interpretation, we will now proceed to the 12-lead ECG.

6 step approach

Please view the following video which illustrates a systematic approach to rhythm interpretation.

3 and 5 Lead ECG

Three or five lead monitoring can be applied for use with both static and telemetry cardiac systems. The 3 or 5 lead systems are attached to electrodes which are applied to specific locations on the patient’s chest. It is important to ensure proper skin preparation prior to application of the skin electrodes.

Please enable JavaScript in your browser to see this interactive content.

See Additional information for common problems associated with cardiac monitoring.

Having set up your specific monitoring system, we will now go on to consider how to interpret the cardiac rhythm using a systematic 6-step approach.

Principles of cardiac monitoring

Continuous cardiac monitoring is an important tool in the clinical assessment of patients with a variety of conditions. It allows the detection of changes in heart rate, rhythm and conduction, and is essential in the detection of life threatening arrhythmias. This is achieved using a cardiac monitor, connected to a cable lead and skin electrodes, which captures the electrical activity predominantly through a single view (commonly lead II).

The monitor function includes:

  • A display of heart rate and rhythm
  • Sound alarms above or below pre-set limits
  • The provision of rhythm strips to document evidence of arrhythmia

Alarms should never be ignored or turned off.

Patients who may require cardiac monitoring include those who are haemodynamically compromised and/or at clinical risk of adverse events, for example, patients with:

  • Chest pain
  • Palpitations
  • Acute Coronary Syndrome – STEMI, NSTEMI, unstable angina
  • Following major surgery – ITU, HDU, cardiac surgery
  • Major trauma
  • Post cardiac/respiratory arrest
  • Acute medical conditions –
    • Pulmonary embolus, drug overdose, electrolyte imbalance
  • Unexplained syncope episodes
  • Shock
  • Undergoing a specific treatment

Please enable JavaScript in your browser to see this interactive content.

The cardiac monitor or telemetry system will be connected to the patient via a 3- or 5-lead cable. This will now be explained.

Person centred approach to decision making for clinical investigations

This is the conversation that happens between a patient and their healthcare professional to reach a healthcare choice together. This conversation needs patients and professionals to understand what is important to the other person when choosing a test or treatment.

It is the role of the healthcare professional to collaborate with the patient and actively encourage him/her to be involved in the decision making, enabling them to make an informed choice about whether or not they agree to having the particular test done or which test they have done, if there are a few possibilities.

The conversation between the doctor/nurse and patient is core to shared decision-making based on the individual’s priorities and preferences, fears and concerns. The BMJ: Time to deliver patient-centred care: BMJ 2015;350:h530

Please enable JavaScript in your browser to see this interactive content.

Pulse point

The overarching aim of patient-centred care is to ensure the patient is an active participant in making decisions about their investigations, treatment and care.

After explaining the risks and benefits of a particular investigation, such as, an angiogram, to the patient, they may feel that they are not willing to accept any risk of stroke and decline to have the angiogram done, even though you believe that they should go ahead with the test because their symptoms warrant it. Although we can explore the patient’s fears further, in the end, we have to accept the patient’s wishes.