Please enable JavaScript in your browser to see this interactive content.
Pulse point
12-lead ECG – posterior-lead placement:
- V1 – V3 are moved round to become V7 – V9
- They are placed on the same horizontal plane as V4
- V7 Posterior axillary line
- V8 Midscapular line in between V7 & V9
- V9 To the left of the spine
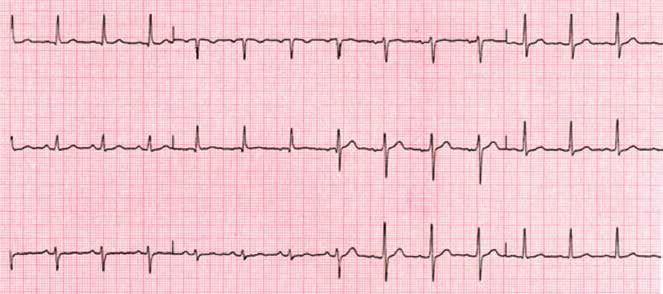
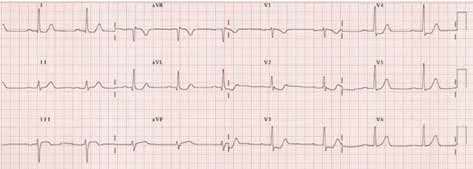
Normal ECG
Anterior STEMI
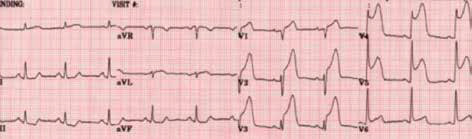
- ST elevation > 2mm in V1 -V4
- Possible lateral involvement due to ST elevation in V5 and V6
For another example of Anterior STEMI see: Acute Coronary Syndrome: Case 2: Joan.
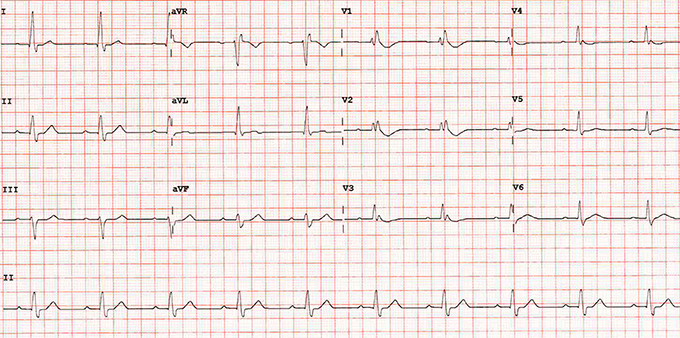
Inferior STEMI
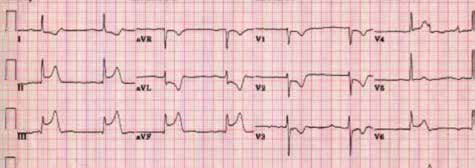
- ST elevation > 1mm in II, III and aVF
- Minimal ST elevation in V6 suggesting possible lateral involvement
- ST wave depression & T wave inversion in leads 1, aVL, V1-3
Lateral STEMI
- ST elevation > 1mm in I and aVL
Posterior MI
- ST depression in V1 and V2
- R wave in V2 suggestive of a posterior infarct
Bundle Branch Block
Identified by examining QRS width and morphology
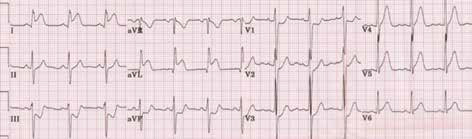
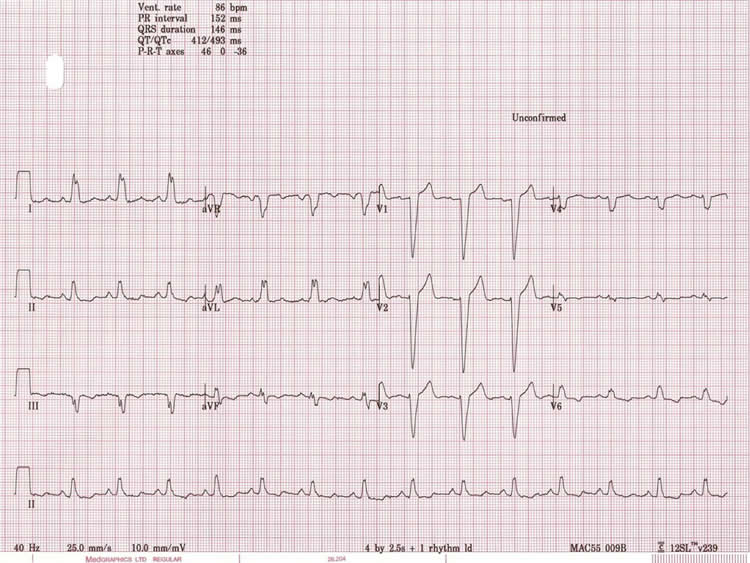
Right Bundle Branch Block
- QRS>0.12 seconds
- RSR’ in V1 and V2 with ST segment depressions and T wave inversion, deep slurred S wave in v6
- QRS in V1 positive
Left Bundle Branch Block
See Acute Coronary Syndrome: Case 3: Naveed
- QRS > 0.12 seconds
- Depolarisation of the septum occurs from right to left
- Q wave in V1
- R wave in V6
Well done, you have reached the end of this section.
What do you want to do next?
- Restart this section
- Select a new section
- Leave feedback
Page last reviewed: 30 Jul 2020